Multi-species spatially-explicit indicators reveal spatially structured trends in bird communities

Author(s): Massimino, D., Johnston, A., Noble, D.G. & Pearce-Higgins, J.W.
Published: January 2015
Publisher: Elsevier
Journal: Ecological Indicators Volume: 58
Digital Identifier No. (DOI): 10.1016/j.ecolind.2015.06.001
The BTO/RSPB/JNCC Breeding Bird Survey is the primary source of information about changes in national populations of over 100 bird species. Here we describe analyses of this dataset which has identified important spatial variation in population indicators, highlighting previously unreported declines in habitat specialists in southern and eastern Britain.
Using biodiversity indicators
In the UK, wild bird population indicators are produced annually on behalf of the Government to monitor the health of the environment. These multi-species indices are calculated by averaging the population indices of birds that typically breed in the habitats of interest. The farmland and woodland bird indicators are those that show the largest declines with losses of 54% and 20% respectively compared to the 1970s baseline. However, these figures mask significant regional and local variation. The BTO has used existing land-cover data to develop a new approach to model breeding densities of birds across the UK from BBS surveys for each species in the indicator for two time-periods (1994-96 and 2007-09). These maps were then combined for each indicator set to show fine-scale spatial variation in temporal trends of both multi-species indicators.
Declines greatest in the south-east
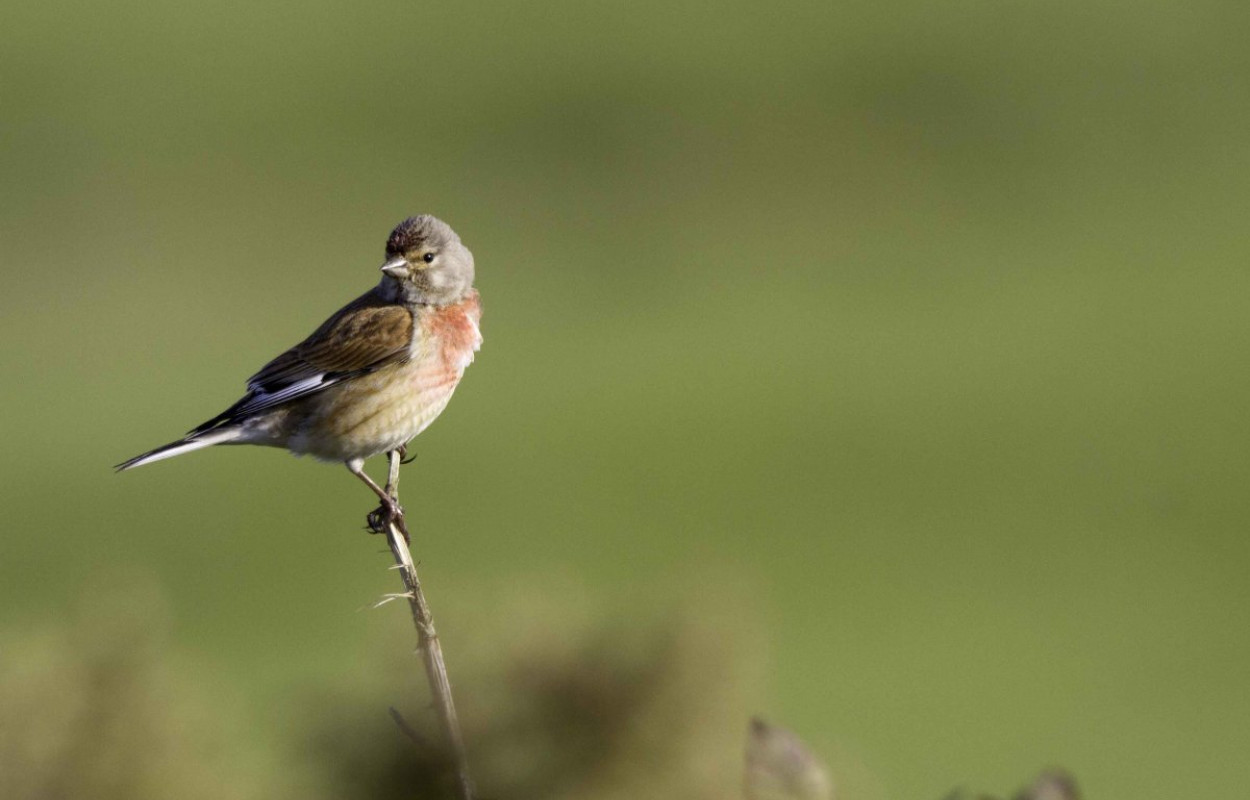
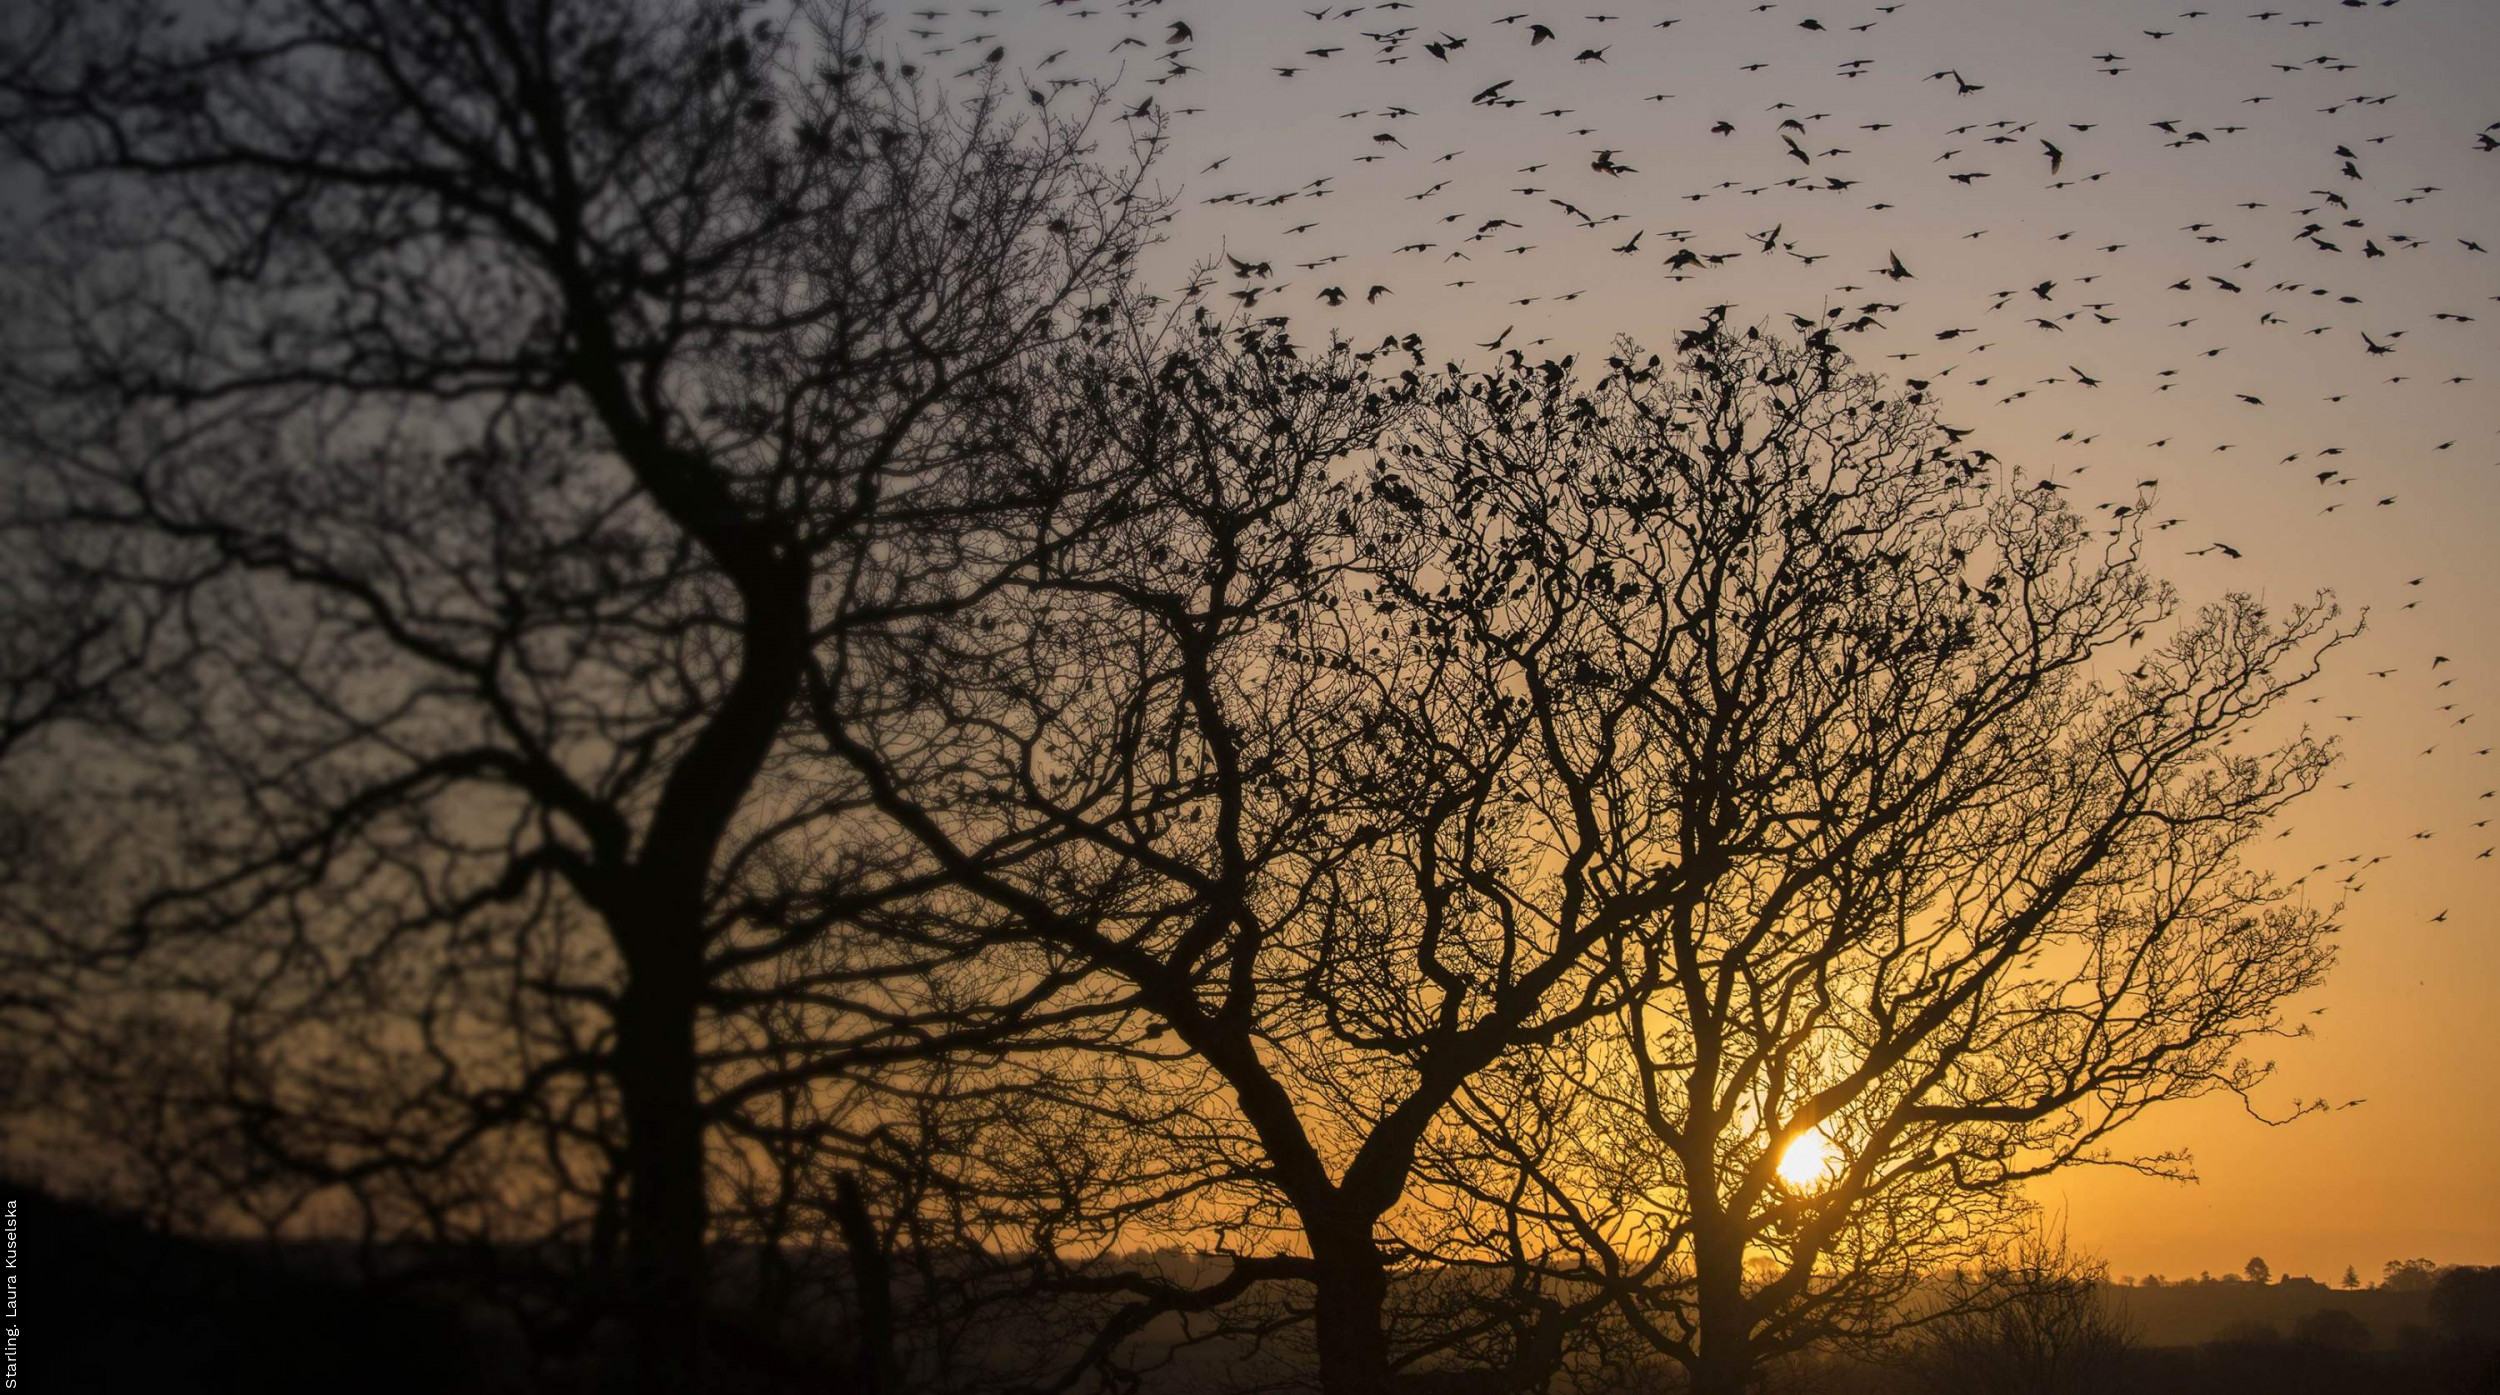
Farmland birds were found to be doing better in western areas where they have been mostly stable compared to eastern areas where they declined extensively since the mid-1990s. Declines were greatest in south-east England and were driven by losses of more than 50% in farmland specialists such as Linnet, Skylark, Starling and Yellowhammer which are Red Listed species in the UK. In contrast to the east-west pattern seen in farmland birds, the woodland bird indicator showed a north-south gradient, with populations in the south faring worse than those in the north. Again, the largest declines occurred in south-east England, particularly for Willow Warbler, Garden Warbler and Bullfinch, where losses of specialists averaged more than 25%, whilst populations generally increased significantly in Scotland. For both farmland and woodland bird communities, indicator trends for specialist species were much more negative than those for generalist species which tend to occupy a wider range of habitats, and showed positive population trends.
What are the reasons for these spatial patterns?
The fact that both farmland and woodland indicator trends are most negative in the south-east of England shows that bird populations in this region are under significant and previously unrecorded pressure. Compared to other regions, south-east England has experienced the greatest degree of long-term agricultural intensification, fragmentation of natural habitats and urban expansion. While these factors are very likely to have continuing negative effects, rising temperatures and risk of drought may also play a role and further work is required to properly attribute these spatial patterns to specific drivers. The UK Government is committed to national and international policies to reduce threats to biodiversity and the results of this research are important to help policy makers identify the areas where conservation actions should be prioritised.
Notes
We are grateful to the BTO members and volunteers who have contributed to the BBS. The BBS is a Partnership between the BTO, Joint Nature Conservation Committee (on behalf of Natural Resources Wales, the Council for Nature Conservation and the Countryside, Natural England and Scottish Natural Heritage) and Royal Society for Protection of Birds. This research was funded through the BBS partnership.


Share this page