Estimating the carbon footprint of citizen science biodiversity monitoring

Author(s): Gillings, S. & Harris, S.J.
Published: May 2022
Journal: People & Nature
Digital Identifier No. (DOI): 10.1002/pan3.10333
Understanding the impacts of climate change relies on an evidence base generated by the thousands of volunteers who participate in biodiversity monitoring. However, survey participation often carries its own carbon footprint, especially where participants travel to and from survey sites by car. Whilst it is essential that we have accurate information about how wildlife is faring in this changing world, we also need to be mindful of any side effects of our scientific activities. A key step is to estimate the emissions produced during biodiversity monitoring.
Abstract
1. Across society there is pressure to assess and reduce carbon emissions to meet the obligations of the Paris Agreement and the Glasgow Climate Pact. Within the science community there is increasing awareness of the carbon footprint of research activities but to date no consideration of emissions associated with biodiversity monitoring.
2. Biodiversity monitoring, often delivered through citizen science schemes, is key to assessing environmental change impacts and mitigation. However, attributes of rigorously designed schemes such as randomisation and high recording effort can require volunteers to undertake regular travel, raising two important questions: a) is biodiversity monitoring reliant on volunteers with private vehicles; b) what is the carbon footprint of a typical monitoring scheme.
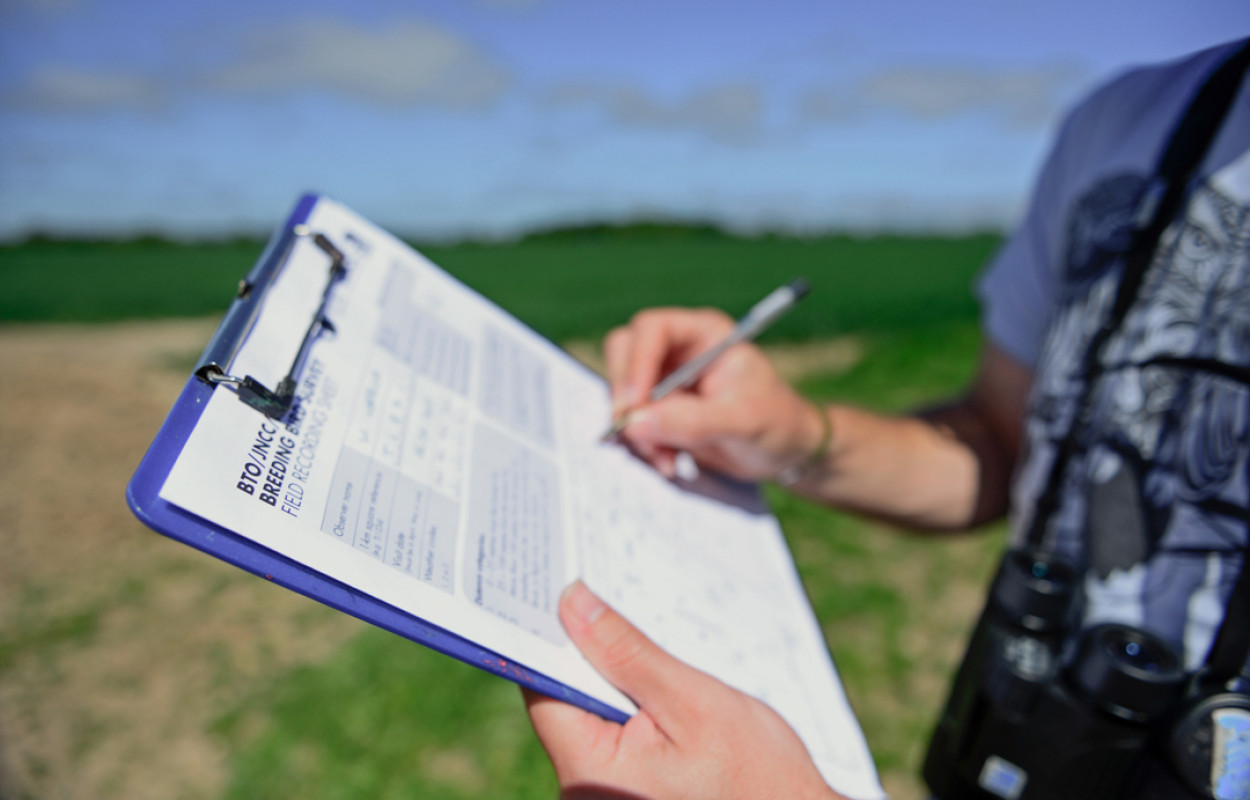
3. This study focussed on travel associated with participation in the UK Breeding Bird Survey. The BBS involves twice-annual surveys of a stratified random sample of 1-km squares across the UK, providing population trends for c120 terrestrial bird species with data used widely in policy and research. Using coverage information from 2019 we calculated road distances from volunteers’ home addresses to their squares and sought information on travel methods using an online questionnaire (54% response rate).
4. In 2019, 2765 volunteers made 7520 visits to 3914 1-km squares, travelling over 286,000 km in the process. Travel required to visit individual squares was highly skewed and differed geographically and according to mode of travel. Eighty-eight percent of squares were accessed by private car, with conventionally fuelled vehicles accounting for 95% of these. Active travel accounted for 10% of visits, and public transport only 1.4%. We estimate the total emissions produced to achieve BBS coverage in 2019 to be at least 46.8 tonnes CO2e.
5. These results indicate a heavy reliance on access to private vehicles, creating a barrier to future participation, especially if pathways to decarbonisation involve reduced car ownership. Furthermore, they indicate the scale of carbon emissions likely to be produced by the monitoring sector. We discuss possible pathways to decarbonise monitoring schemes, but stress that we do not wish to criticise the travel decisions of individual volunteers: the onus on decarbonisation lies firmly with the organisers of monitoring schemes.
We estimated the distance travelled to randomly-selected survey squares by volunteers taking part in the UK Breeding Bird Survey and used a questionnaire to discover the modes of transport used. Over 280,000 km were covered by these journeys, and around 92% of this distance involved private vehicles. Overall, the equivalent of at least 47 tonnes of carbon dioxide was emitted during travel for this critical survey. To put that into context, these emissions are equivalent to the total annual emissions of about four UK adults, or 15 return plane tickets from London, UK to Perth, Australia.
Why does this matter? These emissions may seem insignificant, accounting for 0.0001% of total UK emissions in 2019, but for a sector tasked with monitoring and conserving the natural environment they are concerning. Companies are expected to understand the emissions they produce, not just at their premises, but also in their supply chains; for example, how much carbon is emitted to make the raw materials a company uses?
In exactly the same way, research and conservation institutions need to understand the carbon emitted in the production of their raw materials: survey data. They must also recognise that, often, the requirement for a private car to access remote survey areas is a barrier to participation, and one that may become harder to overcome as transport is decarbonised. Critically, research and conservation institutions need to find ways to balance the benefits of accurate biodiversity information with the carbon costs of acquiring it.
Delve deeper into the research
Principal Data Scientist and publication author Simon Gillings explores the rationale for this research and discusses the results on our blog.
Go to blog


Share this page