Results
Read about the latest Grey Heron population trends from the Heronries Census.
Read the 2024 Heronries Census Summary
The most recent Heronries Census estimate of UK Grey Heron population size is 9,557 apparently occupied nests in 2024.
Heronries Census Summary 2024The latest Grey Heron population trends from the Heronries Census are also discussed on the Grey Heron page in BTO’s BirdTrends report.

The modelled annual population estimates for the UK, now spanning more than 90 years, show a long-term increase in the Grey Heron population size.
We think there may be several contributory factors to the increase in heron numbers, including:
- improvements in water quality;
- a reduction in persecution;
- a growing number of suitable nesting and feeding sites as gravel pits have been flooded and restored.
Variation in the Grey Heron’s population trend
Overlain on the overall increase are dips in population size caused by exceptionally cold winters, especially those of 1946/47 and 1962/63. Each dip has been followed by recovery within a few seasons.
The UK Grey Heron population declined slightly at the start of the current century, before a steep decline occurred around 2010, following successive severe winters. Given the history of the population, the recent trend raises no conservation concern. However, unlike previous declines, there has been no subsequent quick recovery of the population. We do not know why this is the case and the continued absence of any recovery could potentially raise a moderate level of conservation concern in the future.
Heronries Census annual summary report
Our estimate of the UK Grey Heron population size, based on Heronries Census data, is included in the annual summary report.
The most recent estimate is 9,557 apparently occupied nests in 2024, which is a slight increase from the estimate of 9,433 nests in 2023. The report also includes details of the numbers of nests counted for the other species covered by the Census including inland-nesting Cormorants and Little Egret.
Whilst the Census aims to cover all heronries annually, more focused surveys are run periodically with increased promotion to make an effort to increase coverage. The most recent such surveys were in 2018 and 2003.
The Heronries Census project is supported by funding from Gifts in Wills for which we are extremely grateful.
Previous annual summary reports
Annual summary reports have been published online since 2018 and previous reports are listed below:
- Heronries Census 2023 showed a slight increase compared to 2022. Read the summary report for the 2023 survey.
- Heronries Census 2022 showed a slight increase compared to 2021. Read the summary report for the 2022 survey (PDF)
- Heronries Census 2021 showed a slight increase compared to 2020 but a large decrease since 2019. Hence, although the 2020 Census was affected by COVID-19, the 2021 Census results confirmed that a decline had occurred since 2019. Read the summary report for the 2021 survey (PDF, 3.54 MB)
- Heronries Census 2020 was affected by the COVID-19 lockdown which meant that Census visits could not be carried out during the key nesting period (April) and hence population estimates were not published. However, some visits were carried out prior to lockdown in February and March. Read the summary report for the 2020 survey (PDF, 2.30 MB)
- Heronries Census 2019 showed that breeding numbers were similar to 2018. The most recent 2019 UK estimate (taking late submissions into account) is 9,828 apparently occupied nests. Read the summary report for the 2019 survey. (PDF, 437.58 KB)
- Heronries Survey 2018 was the most recent more comprehensive survey and provided the most complete coverage ever recorded in any one year, which produced a provisional population estimate of 10,262 apparently occupied nests. The most recent 2018 UK estimate, which takes late submissions into account, is 9,586 apparently occupied nests. Read the summary report of the initial results from the 2018 survey. (PDF, 1.39 MB)
- Heronries Survey 2003 occurred when population levels peaked and therefore, although fewer sites were covered than in 2018, it provided the highest count of active nests ever recorded in any one year, with 10,411 apparently occupied Grey Heron nests counted in the UK (out of an estimated total of 13,797).
Help us fill in the gaps in the Heronries Census
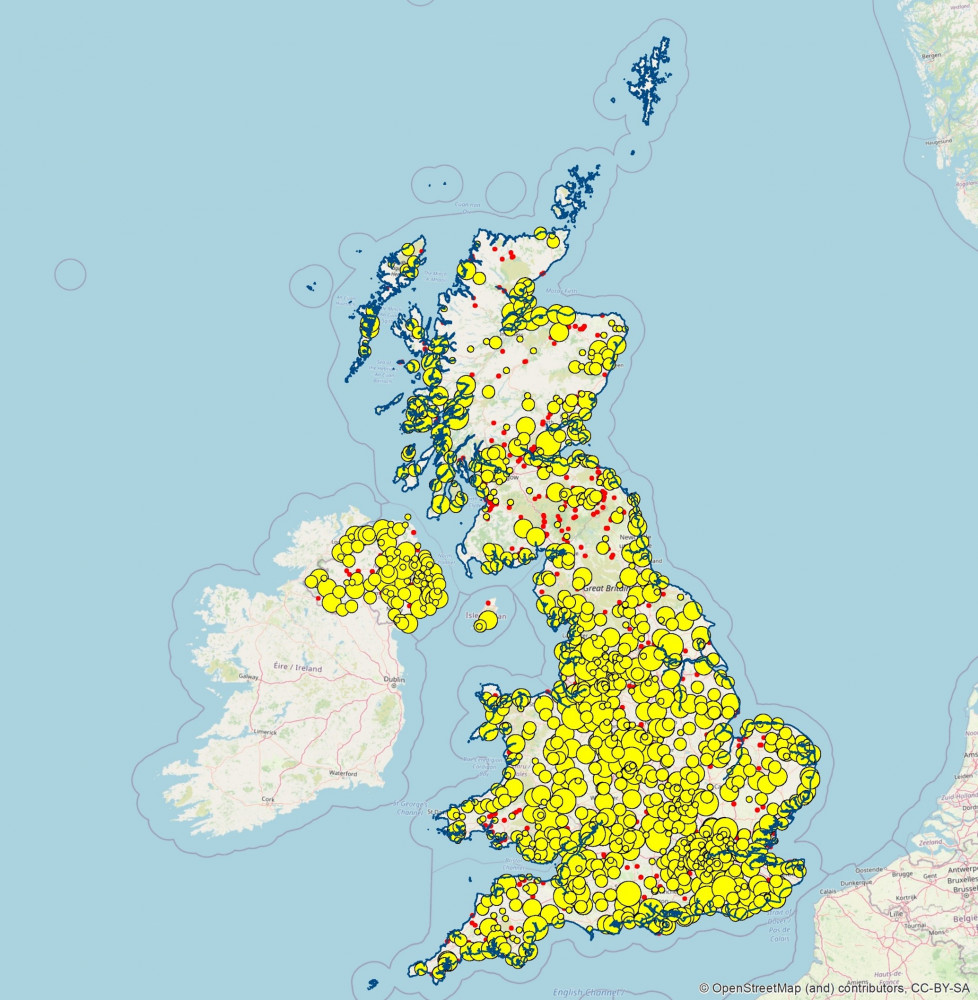
Maps of known heronries across the UK show there are gaps where we would expect to find colonies, including in southern Scotland and parts of East Anglia. If you live in these areas you can provide valuable data by checking suitable woodland habitats and contacting us with your findings.
Locating unrecorded heronries
The Grey Heron is a colonial nesting species, often forming large colonies, although most heronries are much smaller and some pairs do nest on their own. The largest heronries in the UK have around 100 nests but some colonies in Europe are much larger and are home to several hundred pairs.
Like other colonial nesting species such as seabirds, herons can fly long distances from the colony to favoured foraging locations. Therefore the presence of an adult Grey Heron at a wetland site does not necessarily mean that they are nesting near the site.
If you see adult herons regularly visiting a site it might be worth observing them to see whether they arrive or leave in a consistent direction, particularly if they are arriving first thing in the morning or leaving at or near dusk. The direction of flight might help pinpoint the heronry: check any woodlands in that direction.
The best evidence to locate a heronry is if you see a Grey Heron carrying sticks or flying into or out of woodland in which case it would be worth looking more closely to see if you find any nests or other evidence of nesting.
Gaps in the Heronries Census
The locations of heronries reported to the Heronries Census from 2018 to 2021 have been mapped in order to assess the geographical spread of known colonies across the UK.
UK Heronries 2018-2021 (see text for details)
Heronries confirmed to be unoccupied are shown as a red dot. The circular yellow areas depict a ‘buffer’ area around active heronries to show the potential foraging range of the herons, based on the assumption that larger heronries are likely to use a wider geographical area.
Heronries with a peak count of 1 - 3 apparently occupied nests have a buffer area of 4 km (c2.5 miles), with larger buffer areas applied around larger heronries, up to a maximum of 16 km (c10 miles) around heronries with a peak count of more than 30 occupied nests.
These buffer zones are only an approximation. The maximum distance is based on a study by Marion (1984)* which measured foraging distances from two colonies in France at 2.5–16 km and 15–33 km respectively. We have used the lowest of these as a conservative estimate for the maximum distance herons may travel to find food.
Our buffer areas also do not take any account of habitat: many UK heronries are located within or close to wetlands and it is likely that foraging distances for many individuals will be much shorter than the map suggests. Conversely, there may be a small number of sites where foraging distances are longer than average because there is limited availability of suitable and undisturbed nesting habitats close to the heronry.
How you can help
Whilst some of the gaps, such as in parts of the Highlands, are likely to reflect a genuine absence of herons, it seems likely that at least some suitable habitat exists in gaps such as those in southern Scotland and parts of East Anglia.
If you are in an area with no known heronry, please consider checking suitable wooded habitats, especially near wetlands, to try to locate them. If you find one please email herons [at] bto.org.
*Marion, L. 1984. Mise en évidence par biotélémétrie de territoires individuels chez un oiseau colonial, le Héron cendré. Mecanisme de repartition et de regulation des effectifs des colonies de herons. L’Oiseau et la Revue Française d’Ornithologique 54: 1–78.


Share this page